Dashboards
Dashboards your team builds without waiting for BI
DeepMiner dashboards bring together widgets on your indexes: KPI with an icon, line, bar, area, pie, donut, Pareto and table. You create the panel by describing what you need to the AI assistant, or add widgets one by one. Global filters apply to every widget, and each widget can refresh itself at the interval you set.
What you do
Configurable widgets, global filters, an AI assistant and automatic refresh.
-
Create with AI
Describe the goal, the period and the cuts, choose the indexes and the assistant lays out the widgets. Ready-made templates help you start, and you can dictate the request with the microphone.
-
Changes on request, with review
In the editor, ask for one change at a time, such as adding a ranking by segment. The AI proposes, you review and accept or undo.
-
Fully configurable widgets
Choose the chart type, the index, the metric (count, sum, average, minimum, maximum, distinct values, percentiles), the grouping and the period. KPIs get an icon, position, size and color.
-
Global filters
The Filters panel applies the same cut to every widget, shows the count for each value and can be saved as the dashboard default.
-
Automatic refresh
Set, in seconds, how often each widget fetches the data again. The operations panel stays open and up to date.
From request to panel
In Create with AI, describe the dashboard: which decision it supports, the period, the cuts and the comparisons. Choose the indexes that hold that data. The assistant only uses fields that exist in those indexes and delivers a dashboard ready to edit.
If you prefer to build by hand, New widget opens the editor: title, chart type, index, metric, field, grouping by value, by date or by range, and the date field for the period. Widgets can be moved and resized, and the layout is saved.
One panel for the whole operation
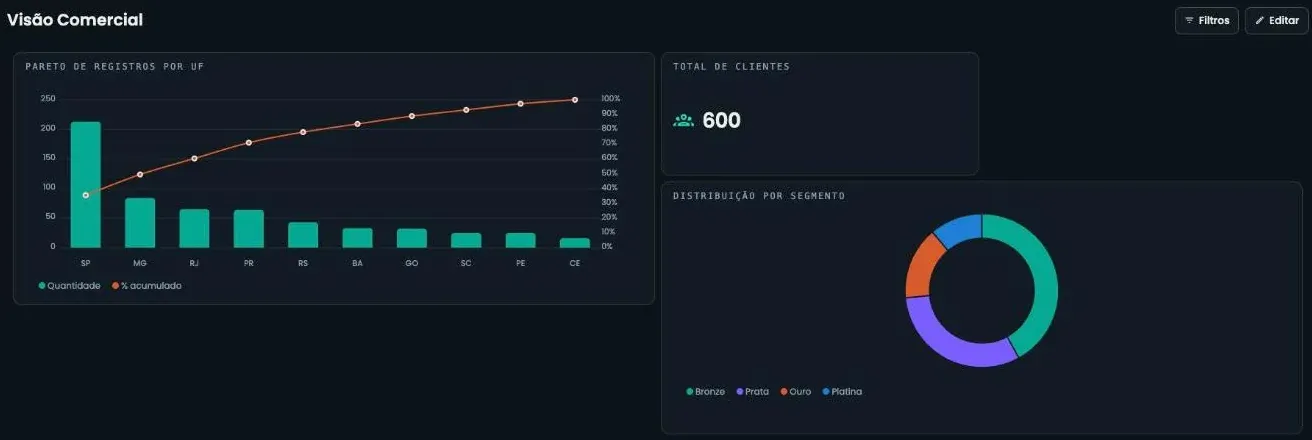
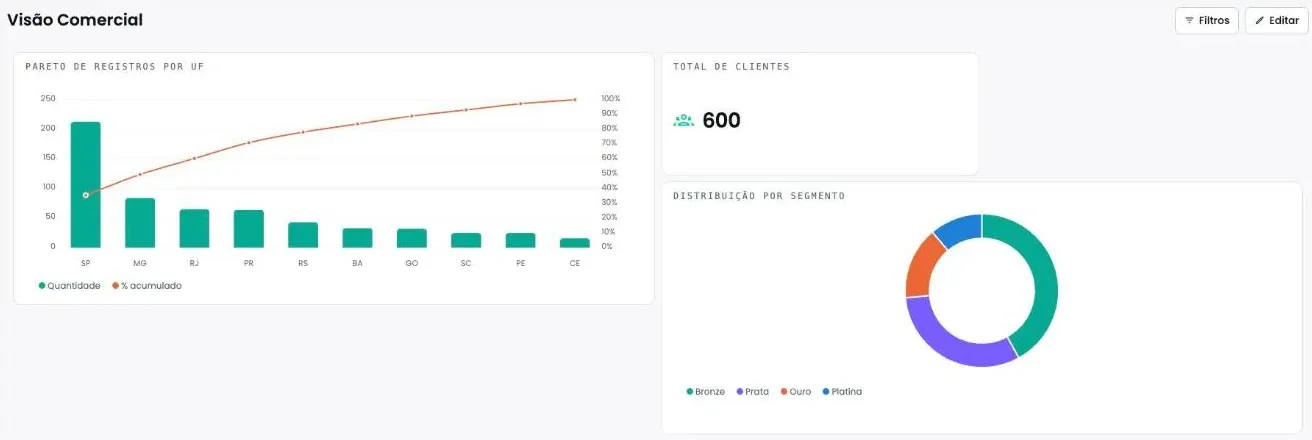
Global filters work on fields from one or more indexes. Pick Gold and Platinum in the segment filter, for example, and the Pareto by state, the total customers KPI and the donut by segment change together. A filter saved as the default is already applied on the next visit.
The KPI has a configurable icon, such as customers, portfolio, message or alert, plus color, position and size. That way the key number can be read from across the room on an operations screen.
When the data changes
Each widget has a Refresh every (s) field. With it, the numbers from new imports show up on the panel without reloading the page. The data comes straight from the indexes, which receive every new import.
Frequently asked questions
Dashboards
Do I need a separate BI tool?
To follow the data that lives in DeepMiner, no. Dashboards read straight from the indexes. If your company already uses a BI tool for other data, the two can coexist.
Which chart types are available?
KPI, line, bar, area, pie, donut, Pareto and table.
Does the AI change my dashboard on its own?
No. It proposes the changes and you accept or undo them. Everything it generates opens in the editor, where you move, edit and remove widgets.
Does the dashboard show CPF or phone numbers in a table?
No. Sensitive fields do not appear as table columns.
Can I take a chart from the chat to the dashboard?
Yes. Every answer with a chart in the Data Assistant has an Add to dashboard button.
See DeepMiner working on your data.
Book a demo and watch a dataset get indexed, enriched and queried.