AI on your data
Ask your data. It answers with a chart.
The DeepMiner Data Assistant answers natural-language questions about your indexes. It uses OpenAI or Azure OpenAI models, builds the query, runs it and returns an answer formatted in Markdown with a chart: bar, line, area, pie, donut, KPI, Pareto or table. You choose which indexes it searches, can compare more than one in the same conversation and send the chart to a dashboard.
What you do
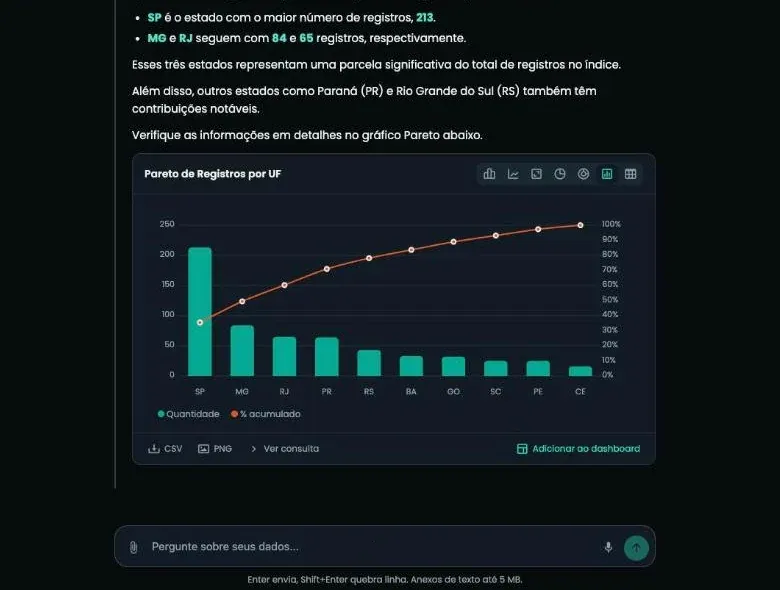
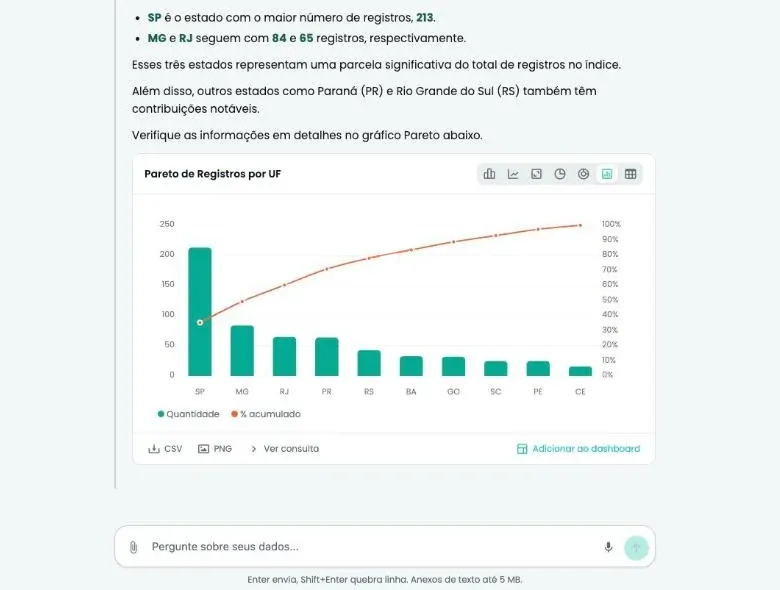
Ask in natural language. The assistant queries your indexes and returns the answer with the chart.
-
Ask in natural language, get a number back
Write the way you would talk to an analyst: how many customers per state, which segment concentrates the portfolio. The assistant queries the index and answers with the numbers it found.
-
More than one index in the same question
In the Sources selector you leave all indexes on or pick a few. You can compare the count by state between the retail dataset and the collections portfolio and ask for the difference in a table.
-
The chart comes ready
Every answer with data brings a chart. Switch the type with one click, download it as CSV or PNG, open the query that ran and use Add to dashboard.
-
Sensitive fields stay out of the prompt
CPF, CNPJ, phone and email fields are recognized as sensitive. The model sees the field name and type, never the values, and the query does not group records by them.
-
Organized conversations
Conversations sit in the sidebar, grouped by date. You search, rename and delete them, and pick an analysis back up where you left off.
What you do in the Data Assistant
Open a conversation, choose the sources and ask. “Show the distribution of customers by segment.” “Make a Pareto of the portfolio by city.” “Compare the count by state between Retail Customers and Collections Portfolio and show the difference.” The assistant answers with the text and the chart in the same message.
The answer comes in Markdown: lists, bold on the numbers that matter and tables when the question calls for a comparison. If the result is large, the chart tells you it is showing only the first rows.
You can also attach text files to the message and dictate the question with the microphone.
From chart to dashboard
The chart in an answer can become a bar, line, area, pie, donut, KPI, Pareto or table without a new question. View query shows the query that ran, for anyone who wants to check the filter. CSV and PNG carry the result to another tool or into a presentation.
When the analysis turns into ongoing tracking, Add to dashboard saves the chart as a widget. From then on it follows the dashboard filters and no longer depends on the conversation.
Limits that protect your data
The assistant only queries your partner’s indexes. One partner’s data never shows up for another.
Sensitive fields, such as CPF, CNPJ, phone and email, are recognized by name and type. The model receives the field name and never the values. The query does not group by those fields and, in filters, accepts only equality comparisons. A question cannot make the assistant list CPFs or phone numbers from your data.
Frequently asked questions
AI on your data
Do I need to know SQL to use the assistant?
No. You write the question in natural language and the assistant builds the query. If you want to check it, the View query button shows what was run.
Which AI model does DeepMiner use?
OpenAI models, served by OpenAI or by Azure OpenAI, depending on the platform configuration.
Does the AI read my customers' CPF or phone numbers?
No. Sensitive fields enter the context with name and type only. The values are not sent to the model, and the query does not group by those fields.
Can I cross-reference two different datasets?
Yes. Pick the indexes in Sources and ask for the comparison. The assistant queries each index and cross-references the summarized analyses, such as the count by state for each one.
Can I take the chart to a dashboard?
Yes. With Add to dashboard you pick an existing dashboard or create a new one, and give the widget a title.
See DeepMiner working on your data.
Book a demo and watch a dataset get indexed, enriched and queried.